Should it be a pie chart? A column chart? Or a bar chart?
Let Excel do the hard work for you.
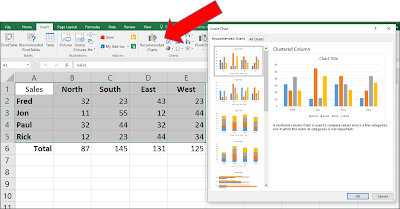
Excel's Recommended Chart feature will recommend the best charts for your data.
It's easy to let Excel show you the best charts for your data.
Here's how to do it in Microsoft Excel 2013 and 2016:
1. Select a cell in the range of data you want to see as a chart.
2. On the ribbon bar, select the "Insert Tab".
3. Click "Recommended Charts".
That's it. Enjoy!
READ MORE
OneCoolTip.com
- Use Quick Analysis to Explore Your Data i Microsoft Excel
- How to Insert a Screenshot in Microsoft Power point, Word, Excel or Outlook
- Do Things Faster in the New Microsoft Word 2016
- Total an Excel Column Faster With This Keyboard Shortcut
- Select an Excel Data Set Faster with this Shortcut
- This Power Point Tip Will Make You the Focus
OneCoolTip.com
Cool Tech Tips for a Cooler Life!
#Microsoft #Excel #Recommended #chart


No comments:
Post a Comment